
The AUD/USD currency pair is stirring up intrigue, and it might just be the turning point we’ve all been waiting for! Imagine being at the forefront of a potential shift after months of decline—this is your chance to explore the adrenaline-filled world of AUD/USD Bullish Trading for Beginners.
Whether you’re just starting your forex adventure or eager to uncover where the pair could move next, this guide will equip you with the knowledge to spot opportunities and take that first bold step into the market. Remember, every trading decision comes with risks, so never trade more than you can afford to lose. Are you ready to uncover the possibilities and see where the market takes you? Let’s get started!
What’s Happening With AUD/USD?
Since late September 2024, AUD/USD has been stuck in a bearish (downward) trend, falling from 0.6830. But finally, the charts are showing signs that this trend might turn bullish (upward). Before we dive into the details, let’s first understand the key tools and indicators traders use to analyze the market.
“Discover the exciting world of AUD/USD Bullish Trading for Beginners, where mastering bullish trading strategies opens the door to understanding and thriving in the dynamic forex market.”
Quick Introduction to Essential Indicators
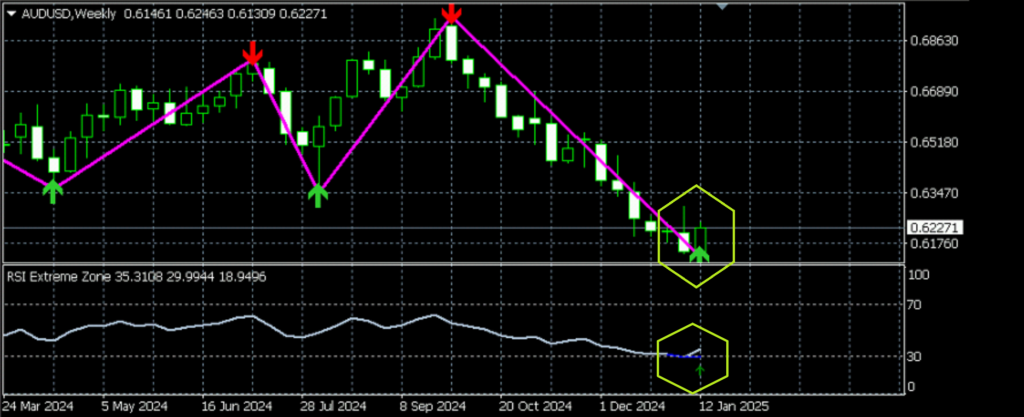
- RSI (Relative Strength Index): Measures the strength and momentum of a trend. When it hits an extreme low or high, it can mean the trend is losing power. The weekly RSI has hit a “bottom,” hinting that the bearish pressure might soon fade.
- Zigzag Indicator: This tool highlights significant price moves and potential trend reversals. The Zigzag suggests bullish momentum is growing stronger.
- Fibonacci Levels: These are specific price levels traders watch to predict where the market might slow down or reverse. They’re very helpful when planning entry and exit points in trades.
If these terms are new to you, don’t worry! They’re easier to grasp once you’ve seen them in action. Now, let’s take a closer look at what these tools are telling us about AUD/USD.
The Current Analysis
1. Weekly Chart – Long-Term Optimism
On the weekly chart, the RSI extreme has hit a deep low, signaling that the recent bearish trend may have run its course. Combined with the Zigzag indicator, this suggests that the pair could be preparing for a bullish reversal.
We’ve placed a BUY trade based on these signals but are moving cautiously. If prices dip further before reversing, we’re ready to add more trades—but only with small, manageable positions.
2. 4-Hour Chart – Volatility Ahead
According to Jackie, our amazing star-rated senior analyst in the dynamic world of forex, there are key Fibonacci levels worth keeping an eye on in the AUD/USD currency pair. Jackie’s expertise in identifying these critical levels plays a vital role in understanding potential turning points and market momentum. Her keen analysis provides beginners and seasoned traders alike with valuable insights to make informed decisions. Don’t miss the chance to leverage Jackie’s observations as you explore the exciting opportunities in AUD/USD Bullish Trading for Beginners!
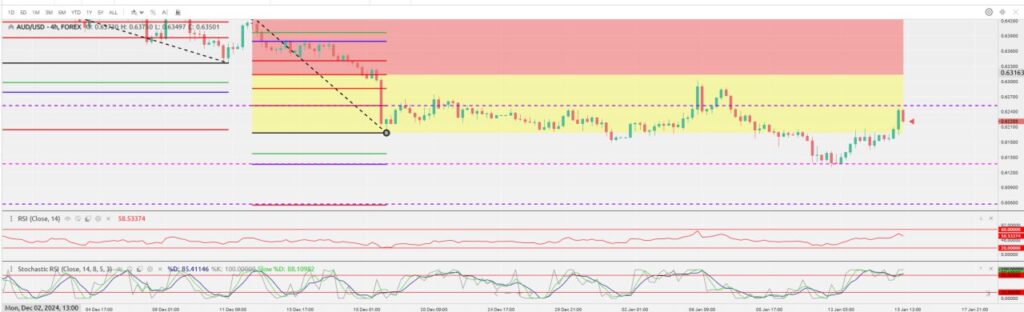
The 4-hour chart tells a slightly different story. The AUD/USD pair has been zigzagging lower but recently retraced to the 0.236 Fibonacci level at 0.62523. Indicators here suggest short-term bearish momentum might continue:
- The RSI is still below the sell zone, signaling downward pressure.
- The Stochastic RSI, which tracks overbought/oversold levels on shorter timeframes, is also in the sell zone.
The short-term picture hints at some turbulence before a potential upward climb.
3. Daily Chart – A Glimmer of Hope
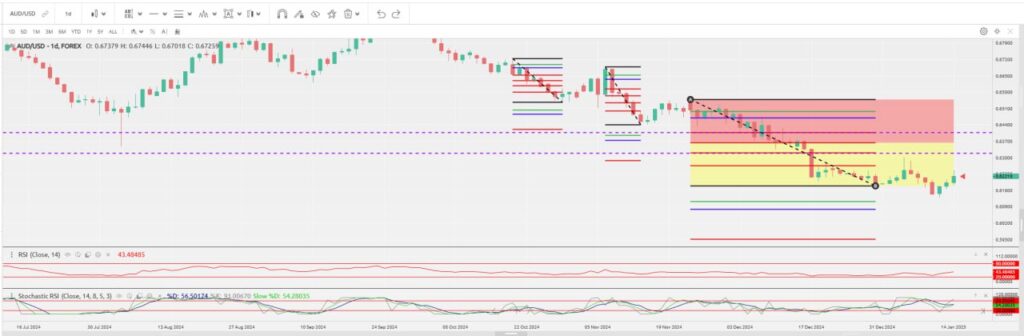
The daily chart offers a broader view. Right now, the pair is trading between the 0.286 and 0.270 Fibonacci levels. Here’s where things get interesting:
- The RSI has moved into the “buy zone” and is starting to trend upward, which is a good sign for building bullish momentum.
- The Stochastic RSI is pointing up, but its signal lines are close to crossing—this could indicate a temporary dip before the pair recovers.
It’s likely that AUD/USD will touch the 0.270 Fibonacci level at 0.60789 before starting a stronger upwards move.
What This Means for Beginners
If you’re new to AUD/USD bullish trading for beginners, this is a great opportunity to see how different indicators combine to tell a story. Right now, the weekly and daily charts are showing signs of optimism, while the shorter-term 4-hour chart warns of possible volatility.
“Every great trader was once a beginner—step into the world of AUD/USD Bullish Trading for Beginners and uncover the tools to transform your passion into profit. The forex market is full of opportunities waiting for those bold enough to take that first step!”
Forex trading often requires patience, especially during potential trend reversals. These tools—RSI, Zigzag indicators, and Fibonacci levels—can help you read the market, but remember, no analysis is foolproof. Manage your trades wisely and always keep your risk levels low.
A Friendly Disclaimer
We can’t stress this enough—never trade more than you can afford to lose. Forex markets are highly unpredictable, and while tools and strategies can guide decisions, there’s no such thing as a sure bet.
Wrapping It Up
The AUD/USD pair is an exciting one to watch. After a lengthy bearish trend, we’re starting to see positive signs on the weekly and daily charts. While the short-term picture indicates some potential dips, the long-term indicators suggest that a bullish reversal could soon take center stage.
For new traders, this is an excellent chance to learn and observe how various tools work together. Take the time to practice, stay informed, and always prioritize responsible trading.

Beginner’s Guide to AUD/USD Bullish Trading – Is This the Moment to Explore Bold Forex Trading Strategies?
- AUD/USD has been in a bearish slump, dropping from 0.6830 since late September 2024.
- Charts are now showing signs of a potential bullish reversal, igniting excitement among traders.
- Key indicators like Fibonacci levels, RSI, and Zigzag patterns hint at this dramatic market shift.
- Traders are analyzing the technical tools closely for clues to the anticipated upward trend.
- This thrilling moment blends market analysis with anticipation of a strong bullish breakout.
- Stay tuned as the AUD/USD currency pair teeters on the edge of a pivotal and exciting change!
Do you think AUD/USD will turn bullish soon? Share your thoughts or questions in the comments below, and come back for updates. We’ll keep this post fresh with the latest insights as the market evolves. Happy trading!