The GBP/USD pair has been on a remarkable bullish run over the past few days, climbing steadily and fueling excitement among traders. However, market momentum suggests a retracement could be on the horizon, paving the way for strategic profit opportunities. For those ready to act, this is the perfect moment to leverage proven methods like GBP/USD Technical Analysis, Fibonacci Levels for GBP/USD, and insights on How to Trade GBP/USD Using RSI and Fibonacci.
This article dives deeper into the trends, tools, and strategies you need to capitalize on the potential price pullback while staying ahead of market movements. Get ready to take your trades to the next level!
Dive in, and discover how to sharpen your trading tactics, identify key opportunities, and make informed decisions.
GBP/USD Analysis March 2025 – A Comprehensive Guide for Traders
The GBP/USD pair has been the center of attention lately, offering plenty of opportunities for both seasoned market participants and beginner traders. Understanding its trend movements, retracement levels, and key technical tools like Fibonacci, RSI, and Stochastic RSI can unlock profitable trading opportunities. This section dives into a detailed analysis of GBP/USD trends across multiple timeframes and provides actionable insights for trading this dynamic pair.
Current GBP/USD Market Overview
The GBP/USD currency pair, commonly referred to as “Cable,” has shown significant activity in March 2025. Here’s a snapshot of what we’re observing across different timeframes:
- 4-Hour Timeframe: The pair climbed 351 pips, reaching the 1.618 Fibonacci level (1.28658). Signs of a potential retracement are emerging.
- Daily Timeframe: The bullish momentum is strong, nearing a secondary 0.618 Fibonacci level (1.29142). Further upward moves to 1.30266 (0.860 Fibonacci) are possible.
- Weekly Timeframe: A retracement phase has begun, with the pair just below 0.236 Fibonacci (1.30448). The overall tone remains cautiously bullish.
- Monthly Timeframe: The pair is recovering from a significant decline, headed toward a potential target of 1.37430 (1.618 Fibonacci).
These patterns showcase a mix of retracement and trend continuation scenarios, making careful planning essential for GBP/USD traders.
GBP/USD Technical Breakdown by Timeframe
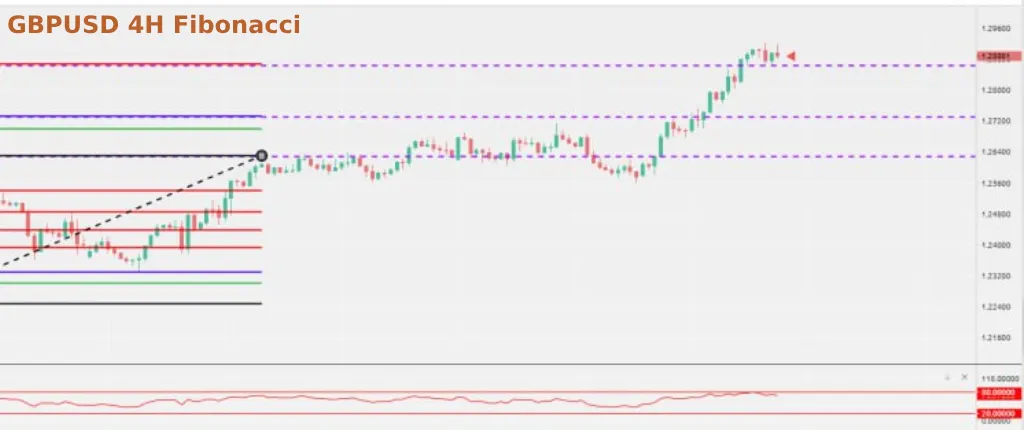
1. GBP/USD 4-Hour Chart Analysis
The 4-hour timeframe reveals short-term trading opportunities.
- Fibonacci Level: The pair is sitting atop the 1.618 Fibonacci (1.28658), a downward correction is expected.
- RSI: Just below the sell zone, signaling weakening bullish momentum.
- Stochastic RSI: Confirmed sell signals with bearish crossovers, heading downward.
Actionable Insight:
- Sell Entry: Near 1.28658, once RSI drops further.
- Targets:
- First: 1.27329 (0.270 Fibonacci).
- Second: 1.26307 (0.000 Fibonacci).
- Stop Loss: Place it above 1.29142 to manage risk.
2. GBP/USD Daily Chart Analysis
The daily chart provides medium-term market insights.
- Fibonacci Level: The pair is at 0.618 Fibonacci (1.29142), with further bullish potential toward 1.30266 (0.860 Fibonacci).
- RSI: Not yet in the sell zone but showing slight signs of a potential downturn.
- Stochastic RSI: Displaying a bullish crossover, indicating continued upward movement.
Actionable Insight:
- Upside Potential: Look for an upward breakout targeting 1.30266 before considering short entries.
- Retracement Signal: A decline below 1.29142 could signal bearish moves down to 4-hour target levels.
3. GBP/USD Weekly Chart Analysis
Larger trends and retracement opportunities come into focus on the weekly chart.
- Fibonacci Level: The pair is approaching 0.236 Fibonacci (1.30448), with potential to trend higher toward 0.000 Fibonacci (1.34314).
- RSI & Stochastic RSI: Indicators suggest a cautiously bullish trajectory but are nearing overbought zones.
Actionable Insight:
- Monitor Resistance: Watch 1.30448 (0.236 Fibonacci) for signs of reversal or continued gains.
- Long-Term Opportunity: A breakout above this level could align with the monthly target of 1.37430.
4. GBP/USD Monthly Chart Analysis
The monthly timeframe offers a big-picture perspective for strategic trading.
- Fibonacci Level: The pair is eyeing 1.37430 (1.618 Fibonacci) as its next major resistance target.
- RSI: Trends suggest steady bullish momentum as it nears overbought conditions.
- Stochastic RSI: Continues to support buying, with no bearish crossover signs yet.
Actionable Insight:
- Upside Watch: If GBP/USD reaches 1.37430, sellers may find lucrative short opportunities at resistance.
How to Trade GBP/USD Retracements
Successful trading often involves mastering retracement opportunities. Here’s how to trade them effectively:
- Combine Timeframes: Align signals from the 4-hour, daily, and weekly charts to confirm trade directions.
- Utilize Fibonacci Levels: These act as reliable indicators for entry and exit levels.
- Follow Indicators:
- Use RSI to confirm momentum shifts.
- Use Stochastic RSI for added precision in overbought or oversold zones.
- Risk Management Is Key: Always employ tight stop-losses, especially near volatile levels such as 1.2900 or 1.30266.
Pro Tip: Monitor news-driven price reactions, especially around economic event releases, to adapt your retracement strategy.
Why March 2025 Is Crucial for GBP/USD Traders
March 2025 brings unique opportunities for GBP/USD traders, with several driving factors influencing the pair’s direction. These include:
- Bank of England Decisions: Anticipated rate cuts are a major focus for GBP strength.
- U.S. Dollar Weakness: Volatility in employment data and fiscal concerns weigh on the USD.
- Geopolitical Influences: Key trade discussions and military spending adjustments impact sentiment.
By combining these factors with technical patterns, March provides opportunities for both short-term and swing trades.
Final Thoughts
For beginner traders, March 2025 offers a valuable opportunity to practice using tools like Fibonacci retracements and RSI. Meanwhile, experienced traders can refine their execution strategies by aligning signals across timeframes and leveraging the levels detailed above.
Get our updates
Want to hone your strategies and stay ahead in the market? Subscribe to our Telegram Updates for exclusive insights, trading tips, and advanced analysis. Don’t miss the chance to elevate your GBP/USD trading to the next level!
Stay disciplined, trust your analysis, and get ready to seize the potential that GBP/USD markets offer this March.
Update 11 March 2025:
GBP/USD Trading Strategies for March 2025 Update
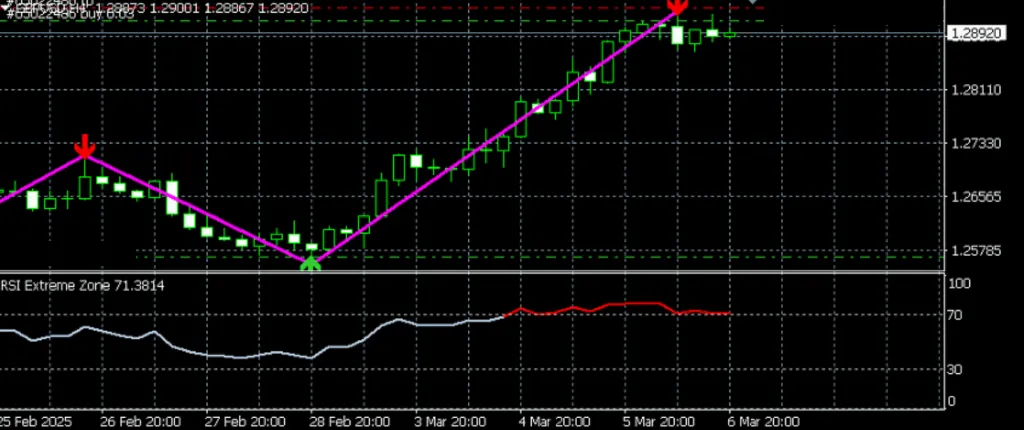
GBP/USD 4-Hour Analysis Update
Building on the previous discussion of the 4-hour timeframe, we see further compelling insights for analyzing the GBP/USD pair. This pair is currently in consolidation following a significant upward movement, though it continues to climb steadily. Key indicators, such as the RSI and Stochastic RSI, suggest that traders should remain vigilant and prepare for potential turning points.
- RSI: The RSI is hovering just below the sell zone, where it has remained for some time. This indicates that while bullish momentum is present, it may soon face resistance.
- Stochastic RSI: The Stochastic RSI is rising higher into the sell zone, with still some room to move before becoming overbought. Neither the green nor the blue lines have crossed yet, which points to a gradual upward trend.
- Fibonacci Levels: The pair is expected to likely continue its climb towards 1.30244, aligning with the 0.270 Fibonacci level. However, traders should prepare for a subsequent retracement. Support is apparent at:
- 0.382 Fibonacci (1.27890): A potential initial target for a pullback.
- 0.618 Fibonacci (1.27010): A secondary support level that could act as a strong anchor for price movement.
Actionable Insights:
For traders, these updates offer actionable opportunities:
- Short-Term Outlook: Monitor the 1.30244 resistance level for potential selling opportunities, particularly if RSI and Stochastic RSI indicators signal overbought conditions.
- Retracement Trades: Set buy entries at support levels of 1.27890 or 1.27010 if the price retraces, aligning with Fibonacci support zones.
- Risk Management: Use tight stop-loss orders above the 1.30244 resistance or below the 1.27010 support to mitigate volatility risks.
These new observations provide additional depth to the analysis of the GBP/USD pair, equipping traders with up-to-date, precise tools for tackling March’s dynamic market conditions. Be sure to align this information with prior charts and patterns to refine your strategy further.
By integrating both the original insights and this update into your trading plan, you’ll be in a prime position to capture the profit potential in one of the forex market’s most active currency pairs. Happy trading!
Pro Tips for New Traders
Starting your trading journey can feel overwhelming, but with the right guidance, it gets much simpler. If you’re wondering how to time the 5 trades in the GBP/USD strategy, here’s a straightforward step-by-step guide tailored just for you. These pro tips will help you trade with confidence while keeping your risk low.
Timing Your Trades Like a Pro
- Trade 1: Sell at 1.30244 (Fibonacci Resistance)
- What to watch for: Wait for the price to climb to 1.30244. Before jumping in, check your RSI and Stochastic RSI indicators. They should show overbought signals (like RSI nearing the sell zone or Stochastic RSI crossing upwards into overbought).
- How to act: Only place this trade when the price approaches this level and you see confirmation of potential resistance.
- Trade 2: Buy at 1.27890 (Fibonacci Support)
- What to watch for: If the price starts to drop, focus on 1.27890. Look for oversold signs, like RSI moving near the buy zone or Stochastic RSI crossing downwards.
- How to act: Set your buy trade when the price nears this level, confirming it holds as a support.
- Trade 3: Buy at 1.27010 (Deeper Support at Fibonacci 0.618)
- What to watch for: If the price falls through 1.27890, your next level to watch is 1.27010. This is more likely to act as a very strong support. Confirm with oversold signals from your indicators.
- How to act: Place this trade if the price dips here, preparing for a potential rebound.
- Trade 4: Scalp Between 1.27890 and 1.30244
- What to watch for: Pay attention to how the price behaves between the range of 1.27890 and 1.30244. This is where the magic of scalping fits perfectly. Watch for short-term signals, like candlestick patterns or small reversals.
- How to act: Use smaller trades (low lot sizes) to capture quick profits while staying within this range.
- Trade 5: Buy Above 1.30244 (Breakout Opportunity)
- What to watch for: If the price breaks through 1.30244, it could signal a strong upward trend. Confirm this breakout with bullish momentum or candles closing strongly above this level.
- How to act: Place a buy trade above this level, but use a trailing stop. This lets your trade ride higher profits while keeping some protection in case the move reverses.
Pro Tips to Keep You on Track:
- Patience is key: Don’t rush to enter all trades at once. Wait for the price to hit the specified levels and confirm with your indicators.
- Stick to the plan: Each trade has its own moment. Follow the sequence and avoid opening all trades together unless the conditions perfectly align.
- Risk smartly: Never risk more than 2% of your account balance per trade. If you’re unsure about lot sizes, use online calculators or ask for guidance.
- Practice first: If you’re new, try these trades on a demo account before using real money. This builds your confidence.
With these pro tips, you’ll have a clear roadmap to execute the GBP/USD strategy without risking your entire account. Stay disciplined, take it one step at a time, and watch your skills grow! You’ve got this!
With this strategy, you’re not just protecting your account but also positioning yourself for smart profit-making opportunities as GBP/USD navigates March’s volatility. Trade wisely and stay disciplined!
Disclaimer: Never invest more money than you can afford to lose. You are trading on your own risk.